Debugging memory in OCaml: any advice?

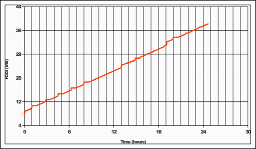
A server I just deployed (written in OCaml, of course) seems to eat RAM at breakfast. This is the chart of the RSS field of "ps" in the past 24h (click to enlarge). The program starts with almost 6 Mb and is now reaching 40 Mb, in a linear trend that has nothing good to say.
Any advice on how to debug the memory consumption?


29 February 2012, 10:35
To begin with, you could use GC stat functions to frequently get GC status, in particular the number of "live_words" (x8, assuming 64 bit platform, gives you the amount of live data managed by the GC). Note that some data, such as Bigarrays, are not taken into account here.
By the way, check that the GC is not disabled (by setting its verbosity level and checking that major collections do happen).
At this point, assuming the GC is enabled, I see two cases :
1 - Most of the used memory is outside the GC. This is tough, you will have to find out what allocates memory outside the caml heap (could be bigarrays).
2 - Most of the used memory is managed by the GC. Then, you can use tools such as ocamlviz to identify what takes most of the memory.
All this requires access to the source code and recompilation.